I tried making a cool Map App
If you haven't read about the story behind this sidequest, start with it, go check it out here: Storytime Blog !!!
After that accident, I started exploring the trails around State College and while I initially wanted to make a trail map - I wanted to experiment with Leaflet.js before I did and that's how I made this project.
Map Dash began as a weekend experiment and the result is a single-page application that layers weather, air quality, satellite, and storm intelligence on top of an interactive Leaflet map.
Designing the Interface
I wanted the interface to feel like a mini control room. Tailwind’s utility classes made it easy to compose a dark-themed layout with a left-hand dashboard selector, geolocation and fullscreen shortcuts, and a responsive map viewport that expands on larger screens. Custom CSS polishes the experience with a pulsing “you are here” marker, harmonized Leaflet controls, and a fullscreen mode that hides surrounding chrome when you need an immersive view.
Bringing the Dashboards to Life
Each dashboard activation leans on Leaflet events and overlays to give immediate feedback. Clicking a card runs the corresponding activate* function, updates the info panel docked to the map, and, when appropriate, paints markers or tile layers directly on the map canvas.
-
Air Quality: Open-Meteo’s air-quality API feeds hourly AQI, PM2.5, and PM10 data; a color-coded circle marker highlights the reading right on the map, so air conditions are instantly visible.
-
Storm Tracker: The National Weather Service GeoJSON feed is parsed into Leaflet layers, and a small Haversine helper estimates how close the nearest alert sits relative to the map center, translating distances into “no threat,” “low threat,” or “high alert” messaging.
-
Satellite Explorer: A custom Leaflet control lets you toggle between Esri, USGS, and Sentinel-2 imagery. Layer changes refresh the info panel so you always know which provider you’re viewing.
Work in Progress
There's a few features I want to add and I'm still figuring out:
- Real-Time Weather: A call to Open-Meteo retrieves the latest temperature and wind readings for the current map center, while an optional OpenWeatherMap cloud layer adds visual context for atmospheric coverage.
- Precipitation Map: If you drop in an OpenWeatherMap key, the app overlays both cloud and precipitation tiles, giving a quick glance at active systems sweeping the area.
Update [11/11/2025]:
Had not touched this project for a while since the weather changed and I stopped finding new trails. Woke up today to a lot of snow and half a dozen warnings on my weather app - so just wanted to check how big it is:
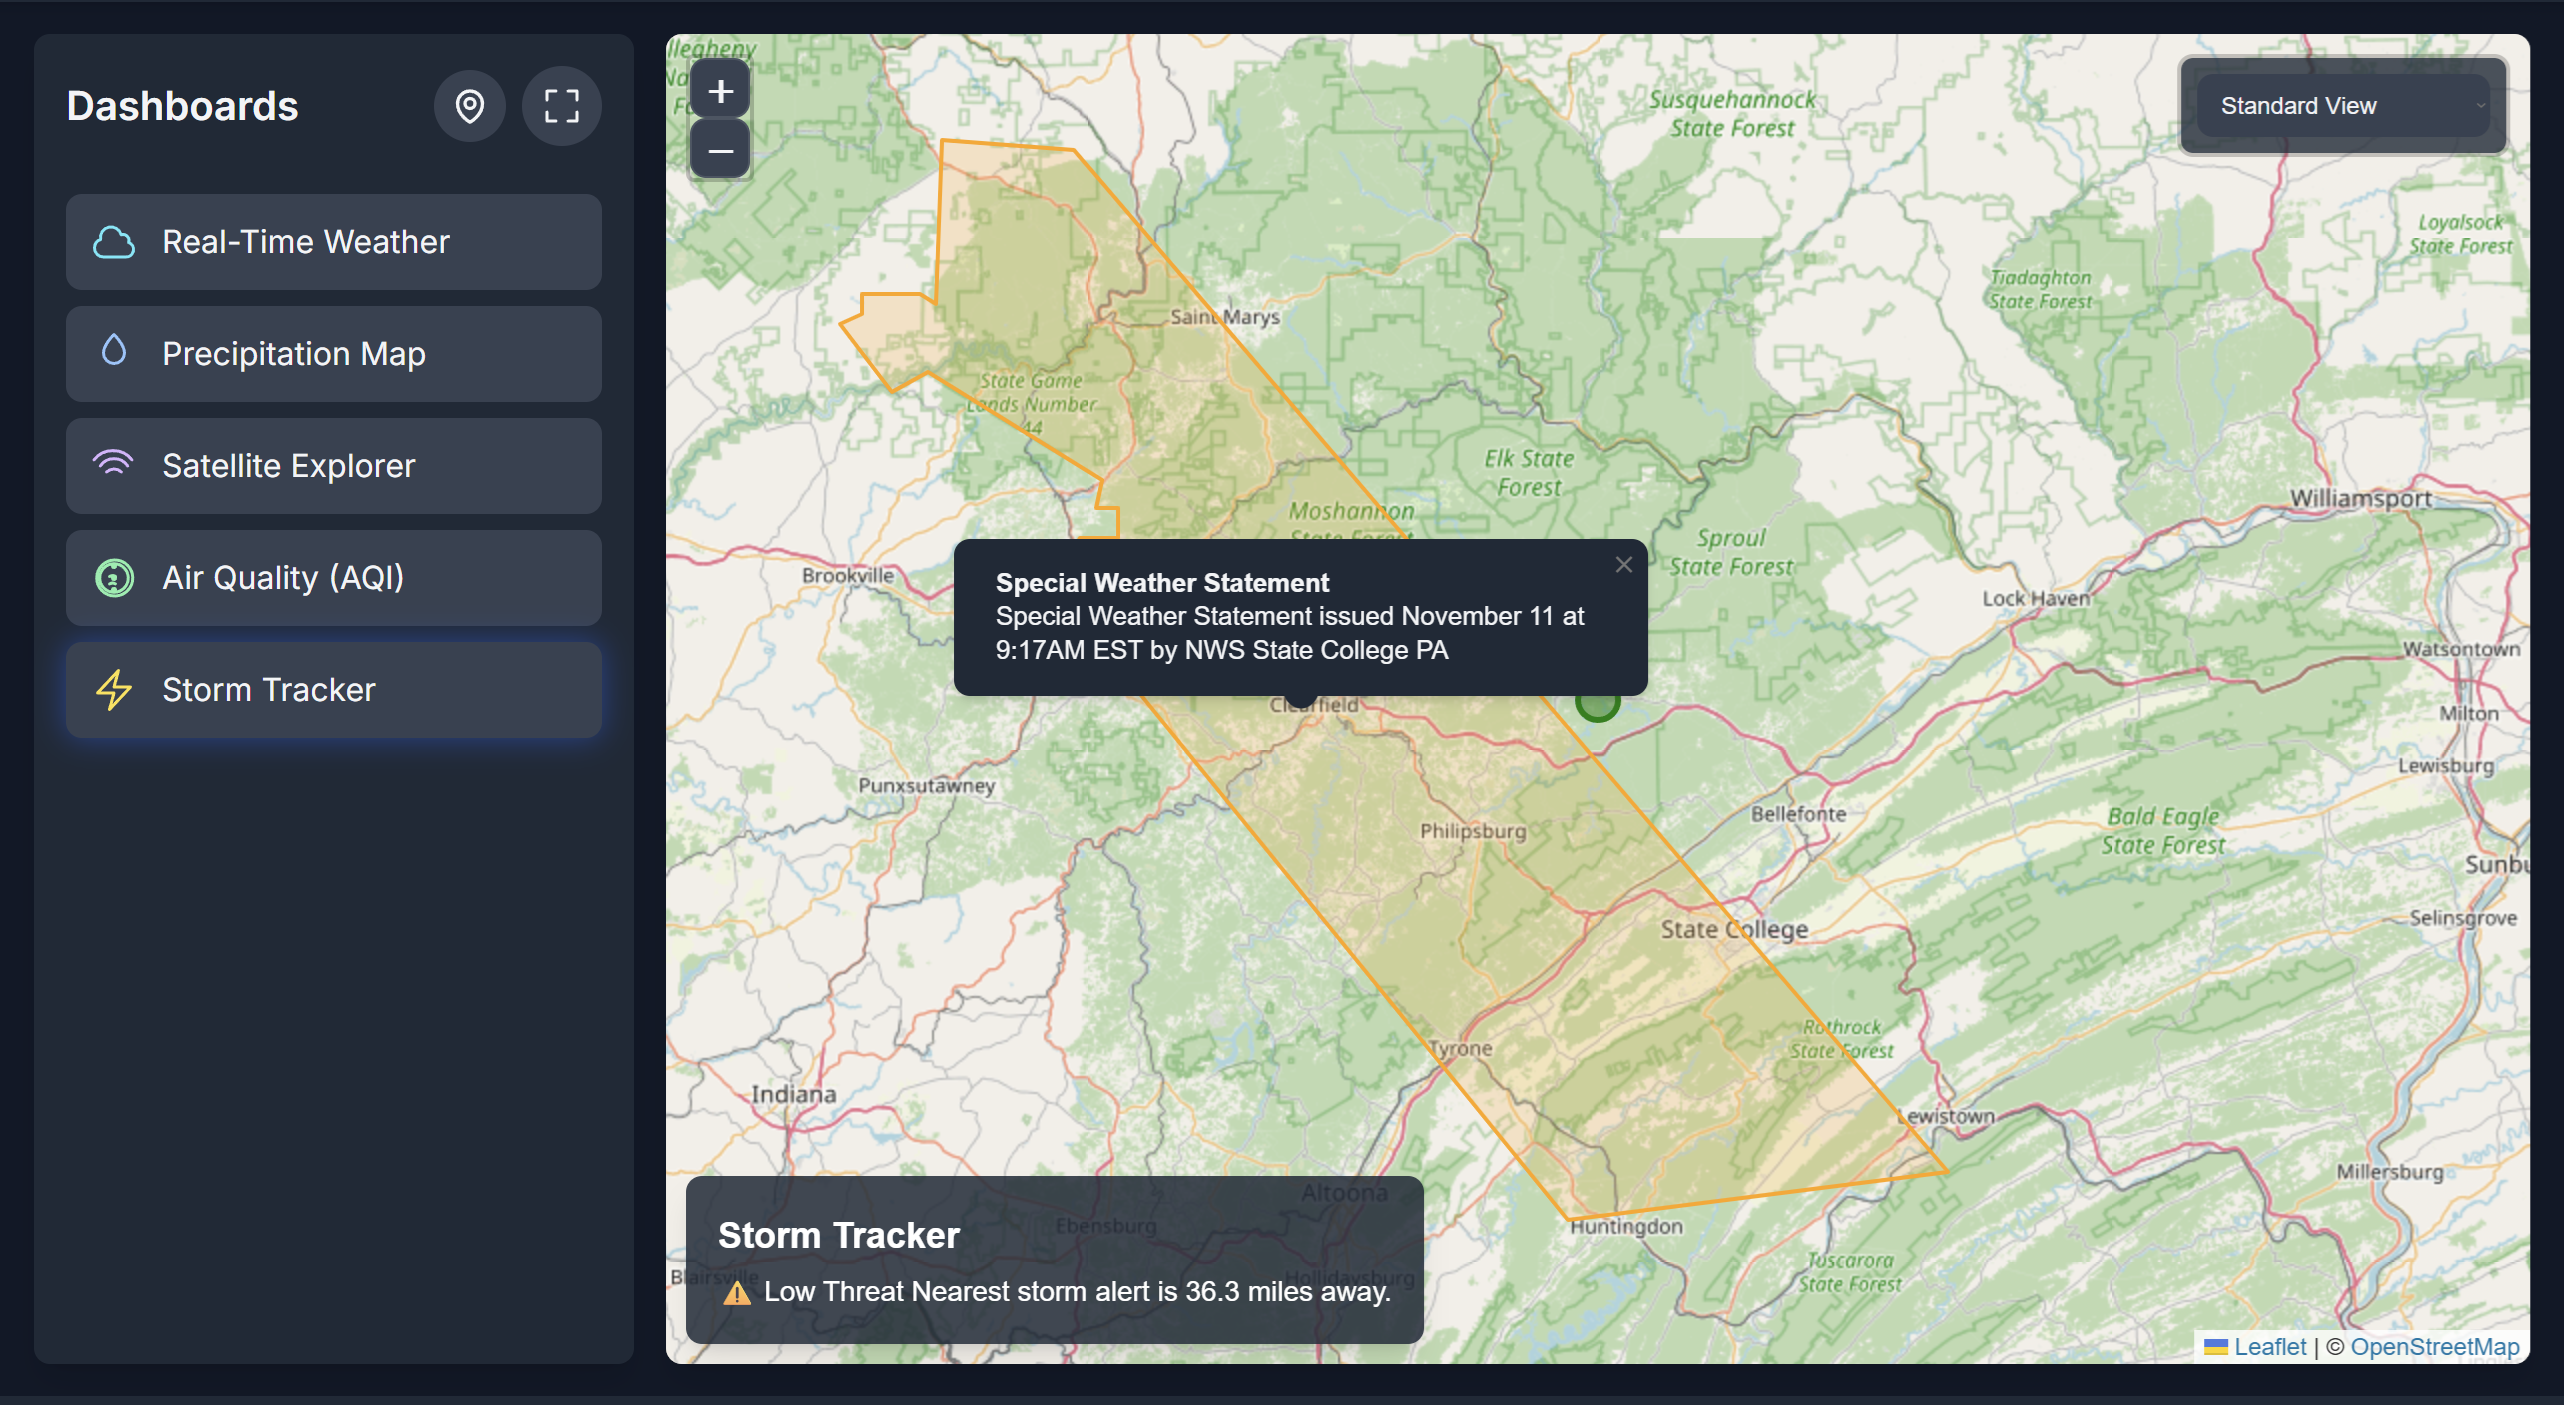 As you can see, that's a huge patch of area over which the warnings have been issued. All the way from the edge of Lewistown up to the elk state forest!
Considering I worked on this project mostly in the summer we didn't have any strong storms near State College, but pretty cool that I finally got to see it in action. First snow of the season too! Stay safe out there :)